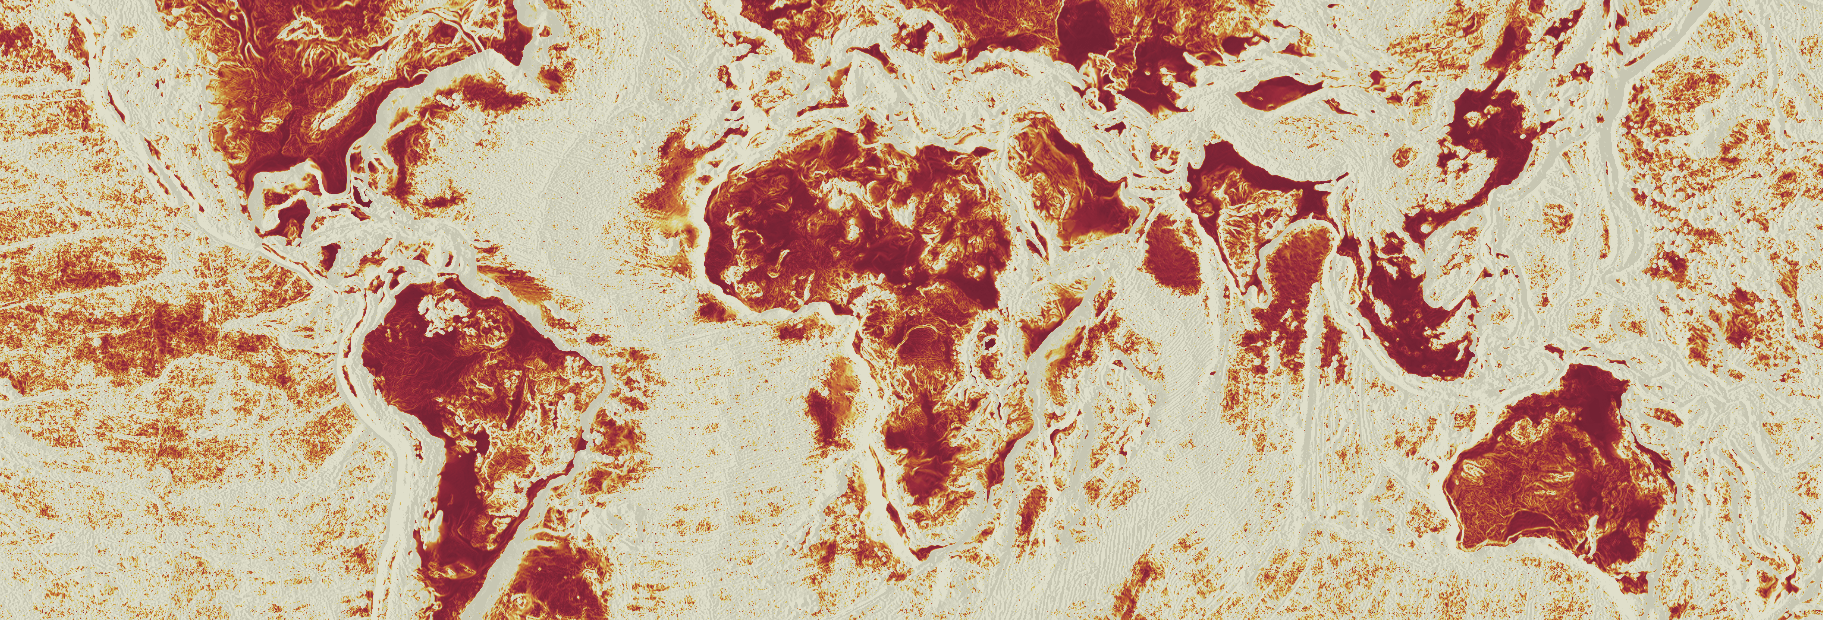
The mission of the Environmental GIS and Cartography Lab (EGCL) is to leverage geographic information, technologies, and techniques to make meaningful scientific contributions, have a positive impact on people and the environment, and disseminate knowledge through digital cartography. EGCL focuses primarily on sustainable agricultural systems in Sub-Saharan Africa and Southeast Asia using multi-scale remote sensing analytics and geovisualization. Current research involves mapping historic, current, and future crop suitability of biodiverse, novel systems that offer ecosystem services and micronutrient variety. EGCL also regularly ventures into the fields of vector-borne disease and insect spatial distributions, human-wildlife-environment interactions, and hydrologic surface dynamics.
Our research interests and philosophies include:
- Sustainable, regenerative, conservational, and scalable agriculture
- Satellite and sUAS (small unoccupied aerial systems) remote sensing of vegetation, climate, and terrain
- Environmental niche, climate change, and protected area delineations
- Big data and cloud geoprocessing via Google Earth Engine
- Land-use/land-cover (LULC) change dynamics
- Transformation of empirical data into scientific knowledge through spatial analytics and cartographic principles
- Geographic theory such as the modifiable areal unit problem and the ecological fallacy problem
- Issues of scale and varying spatial resolutions
Department of Geosciences
EGCL is within the Department of Geosciences at the University of Arkansas, Fayetteville, AR

YouthMappers at UArk
A YouthMappers chapter within the Department of Geosciences at the University of Arkansas, Fayetteville, AR
Center for Advanced Spatial Technologies
A multi-disciplinary center for spatial research and technology at the University of Arkansas